
AI for Manufacturing Quoting Needs an Operations Lens

AI for Manufacturing Quoting Needs an Operations Lens

ARTICLE

AI for manufacturing quoting needs an operations lens

AI can price every line of a fabricated job. It just cannot use what your best estimator knows until someone sits down and captures it.

What AI does in quoting that people cannot

  1. It prices every line on every job.

    A large fabricated assembly carries hundreds of cost lines: plate, coating, bolts, fit-up hours, freight, and more. An AI model trained on the manufacturer's own job costs prices all of them, on every bid. That is how you stop covering the small items with a flat percentage, which is where margin disappears on your largest jobs. In the work we have done, the largest jobs were coming back at 14 percent against a 22 percent quote before anyone had the historical data to see it.

  2. It compares every quote to what the job actually cost.

    Thousands of closed jobs at once, broken out by product line, size, material, customer, and rep. Most manufacturers have never seen this comparison. It shows which work returns the margin you priced and which does not.

  3. It recognizes a bid like one it has seen before.

    When an RFQ matches the product line, size range, and customer profile of a job that ran over, the estimator and inside sales see it while the number can still change, along with what that job was quoted and where the cost went.

  4. It builds the ISO documentation as the quote is built.

    Compliance packages assembled from content that is already approved and revision-controlled, populated from the same job record the quote came from. The package is finished when the quote is, not weeks later. Compliance still signs off.

Connecting the quote to what the job actually cost

All four use cases depend on this connection, and most manufacturers have never made it. The quotes live in spreadsheets. The closed job costs live in the accounting system.

We build the historical data from quoting workbooks, job cost detail, and the general ledger, reconciled job by job. We track quote revisions so each job matches the version that was actually sold, and keep change orders separate from original scope.

The analysis itself is not sophisticated. It goes undone because the reconciliation sits between three functions and belongs to none of them. Sales owns the quote, operations owns what happened on the floor, accounting owns the cost, and nobody owns the mapping between them.

Once the historical data exists, the pattern on large jobs is obvious. The flat percentage carried for small items covers them at ordinary size and stops covering them as jobs grow. Coating overspray grows with surface area. Piece counts climb. Labor efficiency drops across a longer run. Any one of those is minor. Past a certain job size, together, they are the gap.

Sales owns the quote. Operations owns what happened on the floor. Accounting owns the cost. And nobody owns the mapping between them.

What the estimator knows that the historical data does not

At most manufacturers, one or two people price the most complicated jobs, with thirty or forty years of experience. They know which fabrications take longer to fit than the drawing suggests, which customers revise after release, and when a scope will grow. None of it is written down, which is why none of it is in Claude or ChatGPT, and why it leaves when they do.

We capture it by sitting with them on live bids and asking why at each adjustment. Three things come out:

  1. A written account of how estimating actually works, exceptions included
  2. A rule set a system can run and a reviewer can read
  3. A versioned library of the assumptions, standards, and cost bases behind each decision

The second one is what governs the model. Estimators set which assumptions move first and what each round of tuning is measured against. They set where the system stops and raises an engineering error instead of resolving on its own. Every run returns a summary of what parameters were kept or changed and why, so an estimator can defend a price a year later.

One example of what that surfaces: an estimator told us that if a third round of tuning is needed, the earlier adjustments have to reverse rather than stack, because compounding corrections produce a number that means nothing. Nobody asked for that rule. It came out of watching him work.

Miss a rule at that level and every quote the system produces carries the same error before anyone notices.

Nobody asked for that rule. It came out of watching him work.

Five teams rebuild the same job five different ways

Inside sales builds the quote. Engineering rebuilds the scope against code. Operations rebuilds the specification for the floor. Accounting rebuilds cost against margin with burden and workers comp, which is where the margin numbers leadership manages by get formed, reconstructed from a quote never built to carry them. Compliance rebuilds the ISO package after the job ships, because nobody asked what the document needed before it was written.

Vendors miss both, because the requirements come from whoever briefed them, and that is almost always inside sales.

So we ask all five departments what they need before anything gets built. Then quoting moves into a secure web application inside the manufacturer's existing Microsoft 365 environment: pricing maintained in one place, pricing rules held centrally, permissions by role, and approval steps for quotes that need review.

Excel does not go away. Accounting gets its financial breakouts, operations and engineering get the views they work from, compliance gets the ISO package. Every one is generated from the same approved record, so five rebuilds become one. Excel becomes an output instead of the system where pricing lives.

Quoting runs about 70 percent faster, throughput is up about 40 percent with no added staff, and roughly a third of the margin that was leaking on large jobs is back.

Everything above depends on the order of the work. The departments and the estimators first, the technology after. Reverse it and you get a faster quote that is wrong in a new way.

If your quotes and job costs have never been compared, that is where we would start.

Book a Call

Where accuracy matters most
that's where we work

We work anywhere documents carry risk, financial impact, or compliance requirements.

What you're probably
wondering

Quick answers to the most common questions

Can AI improve quoting accuracy in manufacturing?

Yes, but only where the inputs exist. AI can price every cost line on every bid and compare closed jobs against what they were quoted, which no estimator can sustain by hand. Both depend on historical data connecting quotes to final job costs. In most manufacturers that connection has never been built, and no model creates it for you.

Why do AI quoting projects fail?

They usually fail on inputs rather than models. Quotes sit in individual spreadsheets, costs sit in accounting, and nothing links them, so there is nothing reliable for the model to learn from. The second common failure is missing the estimating judgment that was never documented, which means the system runs without rules that experienced estimators would consider obvious.

Where does margin leak in manufacturing quotes?

Most often in the largest jobs. The flat percentage estimators carry for small unpredictable items covers them at ordinary size and stops covering them as jobs grow, because coating overspray grows with surface area, piece counts climb, and labor efficiency drops across a longer run. We have seen jobs quoted at 22 percent returning 14 percent before anyone had the data to see the pattern.

Do you have to replace Excel to use AI in quoting?

No. Excel changes role rather than disappearing. Pricing and pricing rules move into a controlled system with approvals and permissions, and Excel becomes an output: accounting gets its financial breakouts, operations and engineering get the views they work from, and every one is generated from the same approved record.

Why automation projects fail

Why automation projects fail

ARTICLE

We literally watch people work

Still relying on process docs and walkthroughs? This article explains why the documented version of a job rarely matches the real one, and what changes when you watch the work instead.

We Started Watching People Work

Why automation projects fail is rarely a technology question. For a long time, we built automation the way most teams do. We read the docs, reviewed process maps, sat through walkthroughs where someone explained how things were "usually" done. We asked good questions and took notes. Sometimes that worked. Sometimes it didn't.

The pattern showed up quickly. When adoption was slow or ROI took longer than expected, it usually wasn't because the solution was wrong. Automation projects fail for a quieter reason: we didn't really understand the work. Not the version on paper. The version that happens every day.

So, we changed something simple. We started watching people work.

Not demos. Not a cleaned-up flow. The real thing. Slack interruptions. Half-finished spreadsheets. Tabs everywhere. Notes written down because someone will forget later.

Why automation feels risky

A lot of people hesitate when automation comes up. You hear the same things over and over.

"This is too complex."

"No one outside this team is going to get it."

"It'll take longer to explain than to just do."

That hesitation makes sense. Most experienced people didn't learn their jobs from documentation. They learned it over time, by dealing with unusual situations and things breaking. Their process feels fragile because it probably is.

Most jobs are not actually complex. The process around them is. That's hard to see until you watch the work happen.

What shows up when you observe

When you sit with someone and let them do their job, certain things surface fast. Steps that exist only because a system was never updated. Manual checks that were meant to be temporary and quietly became permanent. Data copied from one place to another because "that's just how it's always been done."

None of that shows up in requirements.

One example that stuck with us was an operations team onboarding vendors across multiple regions. On paper, it looked straightforward. Submit information. Review. Approve. Set up.

In reality, they jumped between five systems, re-entered the same data multiple times, and relied on Slack threads when something unexpected came up. The work wasn't hard. It was fragmented. And that fragmentation wore people down.

When we came back and walked them through what we saw, step by step, there was recognition.

Understanding comes before automation

Once people see their process reflected back to them, the tone shifts. They stop worrying that something is going to break. They stop defending the mess. They start asking different questions. What can we remove? What can we simplify? What actually needs to stay manual?

Sometimes automation is the answer. Sometimes it isn't. Sometimes the biggest win is cutting three steps no one needs anymore. Watching the work lets those decisions happen without guessing.

It also changes how we show up. We're not just building what's requested. We're calling out blind spots, avoiding roadblocks earlier, and making better recommendations because we've seen the whole thing in motion.

Sometimes the biggest win is cutting three steps no one needs anymore.

Why automation projects fail, and what fixed it for us

We didn't start this way. We had early projects that were technically solid but didn't quite fit how teams actually worked. Nothing was broken. It just felt off.

Looking back, this is why automation projects fail more often than anyone admits. The build is fine. The fit is wrong.

Watching people work fixed that. Adoption improved. Time to value shortened. Conversations got easier.

When someone sees that you understand their work as it really exists, not how it's supposed to exist, everything else becomes simpler.

Let's start by watching your work.

Before we build anything, we want to see how your team actually operates. Book a short intro call and we'll talk through what's on your plate.

Book a Call

Where accuracy matters most
that's where we work

We work anywhere documents carry risk, financial impact, or compliance requirements.

What you're probably
wondering

Quick answers to the most common questions

Why automation projects fail?

Most automation projects fail because the process being automated was never fully understood. Requirements documents and process maps capture how work is supposed to happen, not how it actually happens day to day. The gap between those two versions is where adoption problems and delayed ROI come from. Teams end up with a solution that is technically sound but does not fit the real workflow, so people quietly work around it.

What is process observation and why does it matter?

Process observation means watching people do their actual jobs rather than relying on documentation or walkthroughs. It surfaces things that never appear in requirements: steps that exist only because a system was never updated, manual checks meant to be temporary that became permanent, and data re-entered across systems out of habit. Observation matters because those hidden details determine whether an automation solution will be adopted or abandoned.

Should every process be automated?

No. Sometimes the biggest improvement is removing steps rather than automating them. Once a team sees their process reflected back accurately, the useful questions change from "what can we automate" to "what can we remove, what can we simplify, and what genuinely needs to stay manual." Automation is one option among several, and observing the work first is what makes that decision possible without guessing.

How to Build a Dynamic Excel Dashboard That Updates Automatically

How to Build a Dynamic Excel Dashboard That Updates Automatically

FREE RESOURCE

How to Build a Dynamic Excel Dashboard That Updates Automatically automatically

Learn how to build an Excel dashboard that updates automatically as you add new data, with no pivot tables and no manual refresh. Includes a free downloadable template you can adapt to your own reporting.

How to Build a Dynamic Excel Dashboard That Updates Automatically

You update your data. The chart doesn't move. So you click Refresh, fix a range, or rebuild something that worked last week.

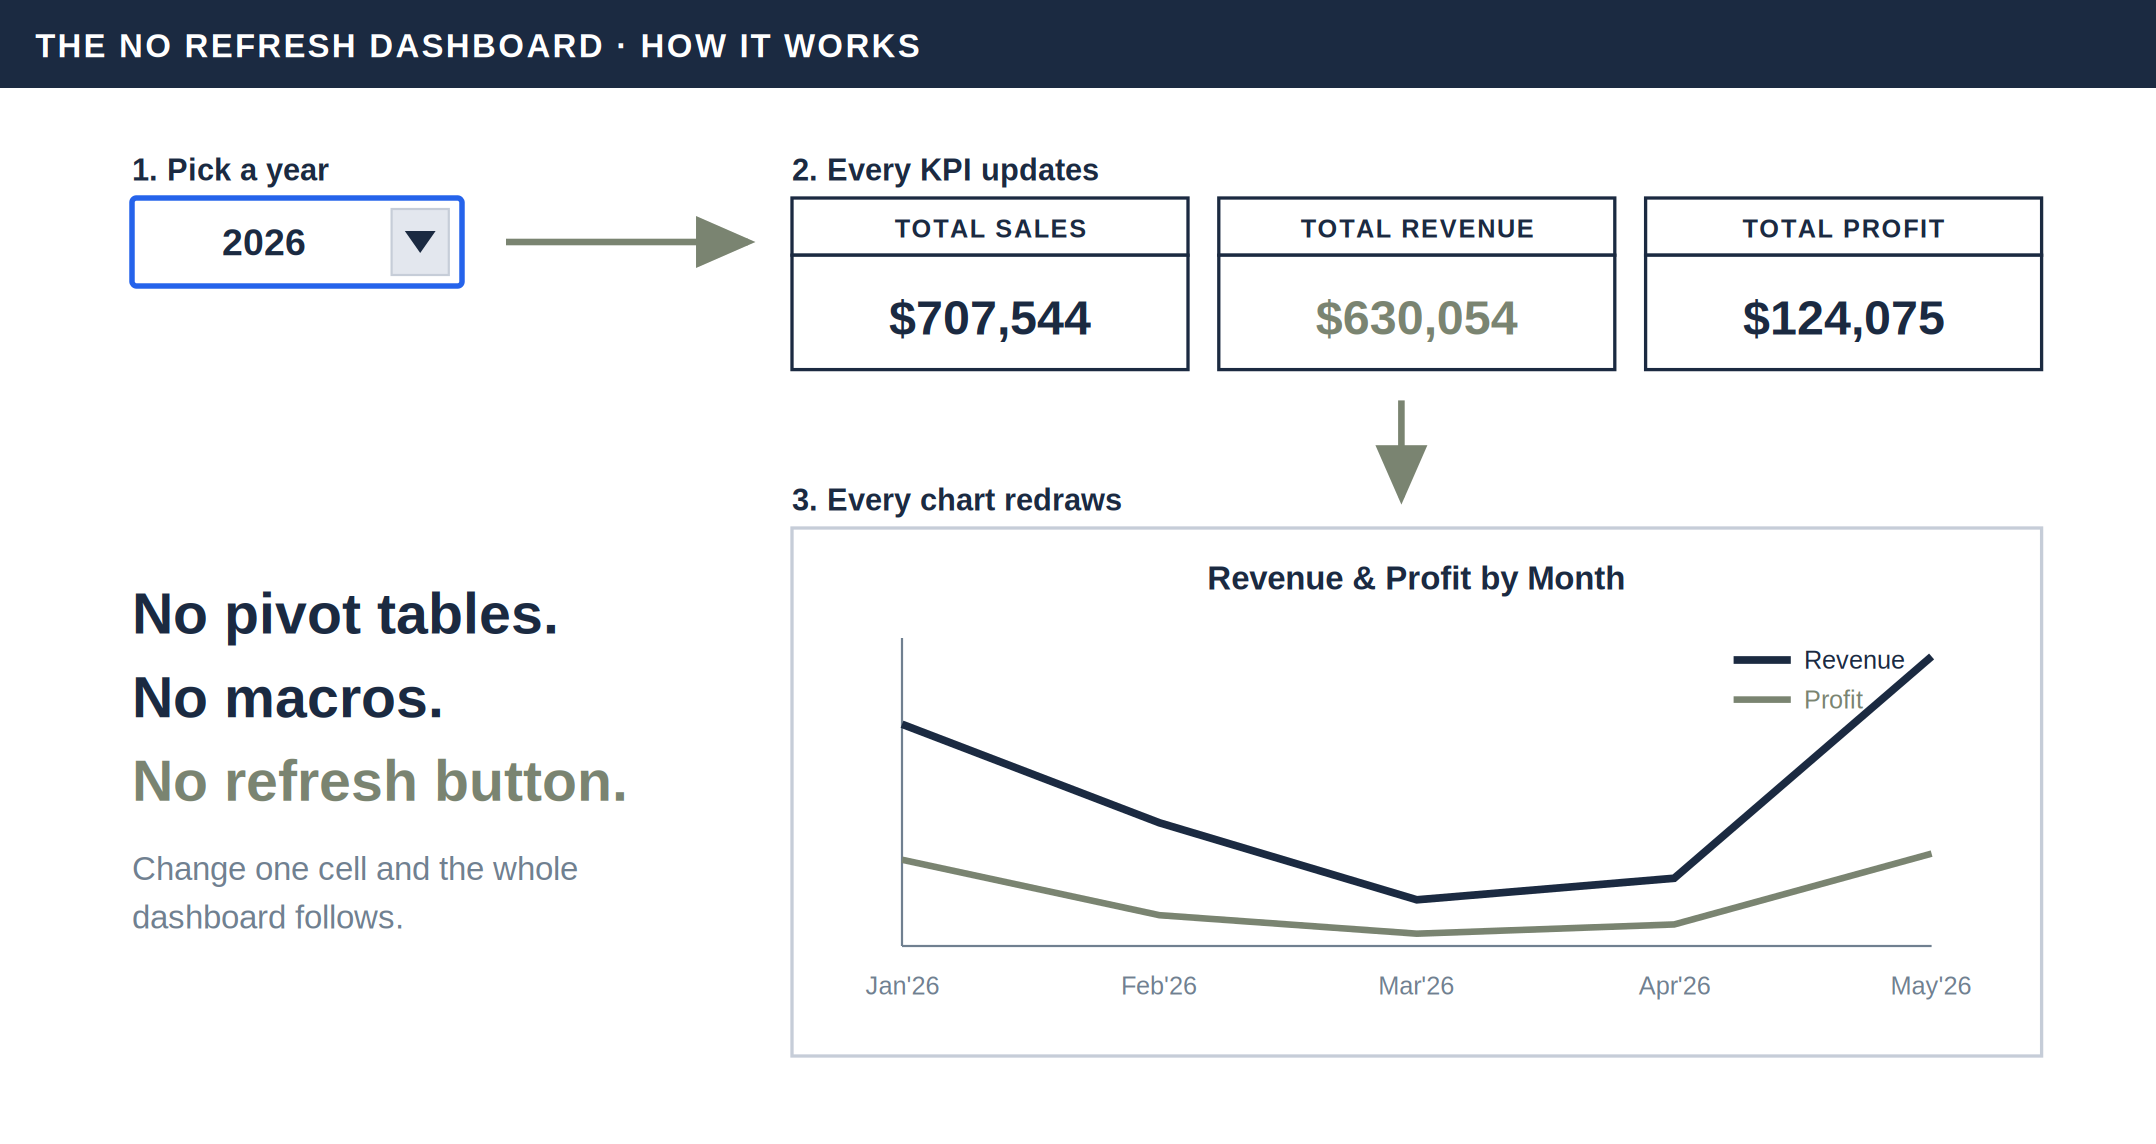
It doesn't have to work that way. With a dynamic Excel dashboard, you add new data and everything on the page updates by itself. No pivot tables, no refresh button, no macros, and no tools outside of Excel.

This is the exact setup we use at XINDARA for client reporting, explained in plain steps. There's also a free template at the bottom of this post with the whole thing already built, so you can follow along or skip straight to a working copy.

How a dynamic Excel dashboard works: one dropdown updates every KPI and chart with no refresh

Why your dashboard breaks when you add new data

Most Excel dashboards point at fixed ranges. A formula like =SUM(B2:B50) only looks at rows 2 through 50. Add a row 51 and the formula never sees it. Your chart has the same problem. It's locked to the rows it was given when you built it.

Pivot tables help, but they hold a snapshot of your data and only update when you click Refresh. Someone always forgets.

The fix is to build with ranges that grow on their own. That's the whole trick, and Excel has had the tools for it since Excel 2021.

The whole trick: stop pointing formulas and charts at fixed rows. Point them at ranges that grow on their own.

Building the dynamic Excel dashboard, step by step

Eight steps, each one small. If you have the free template open, you can see every step already wired up.

Step 1: Turn your data into an Excel Table

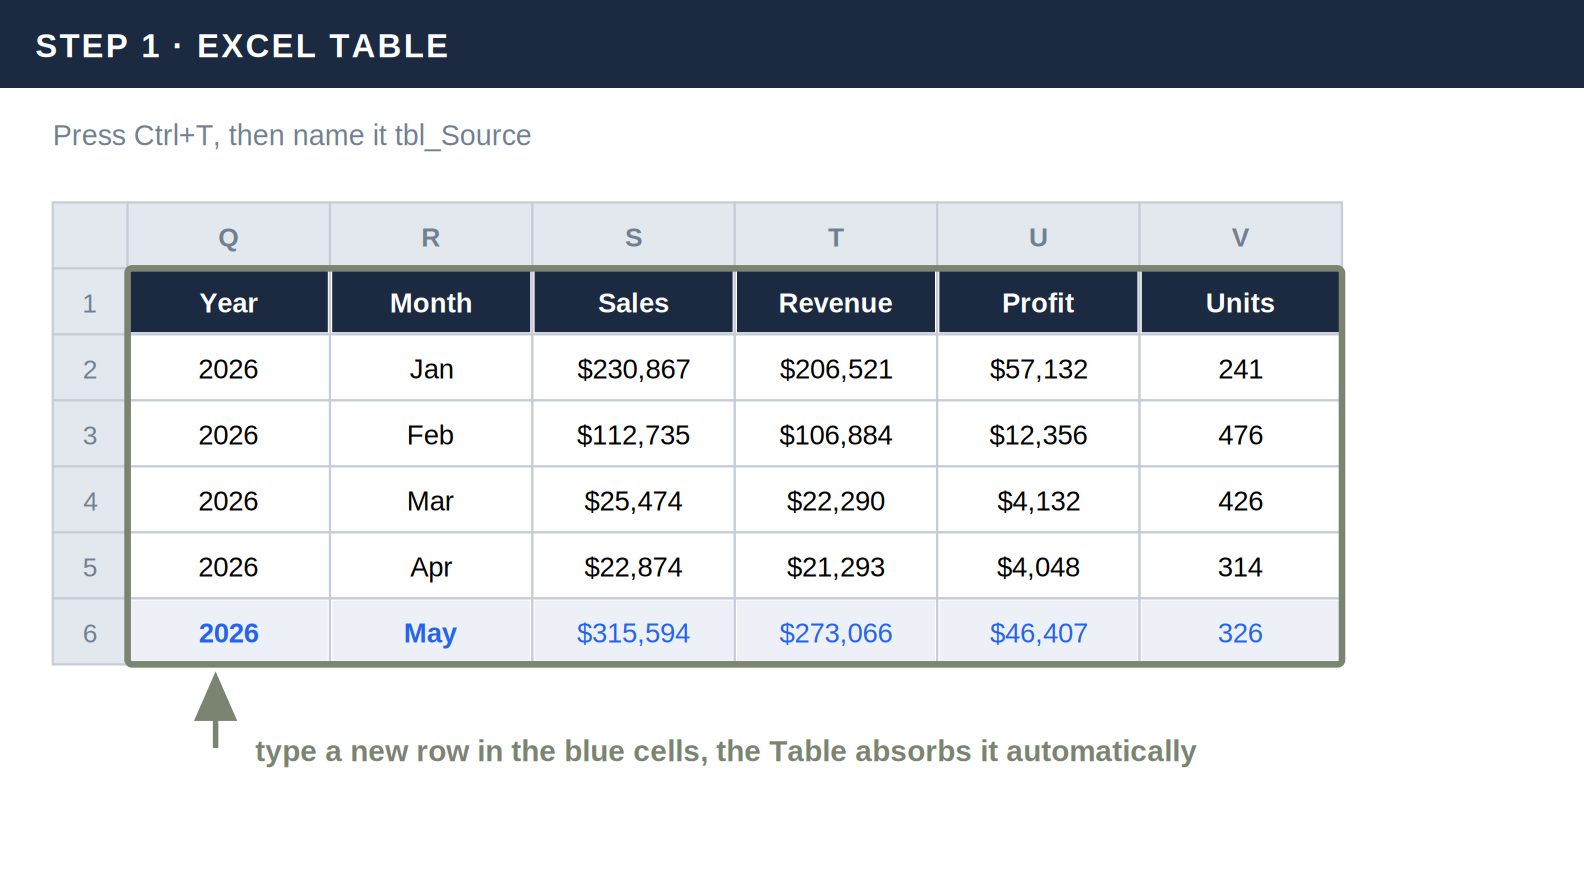
Click anywhere in your data and press Ctrl+T. Check "My table has headers." Then go to the Table Design tab and name it tbl_Source.

Tables are the foundation because they grow automatically. Type a new row under the last one and the Table absorbs it. Anything connected to the Table sees the new row instantly.

Excel Table tbl_Source with sales data for a dynamic Excel dashboard

Step 2: Let Excel fill in the dates

Nobody should type "2026" and "Mar" by hand every time they add a row. In the template, the date columns calculate themselves: each row's Year Month is just the previous row's date plus one month, using EDATE(), and the Year and Month columns read from it. You type your numbers, the dates handle themselves.

Step 3: Add a Year dropdown

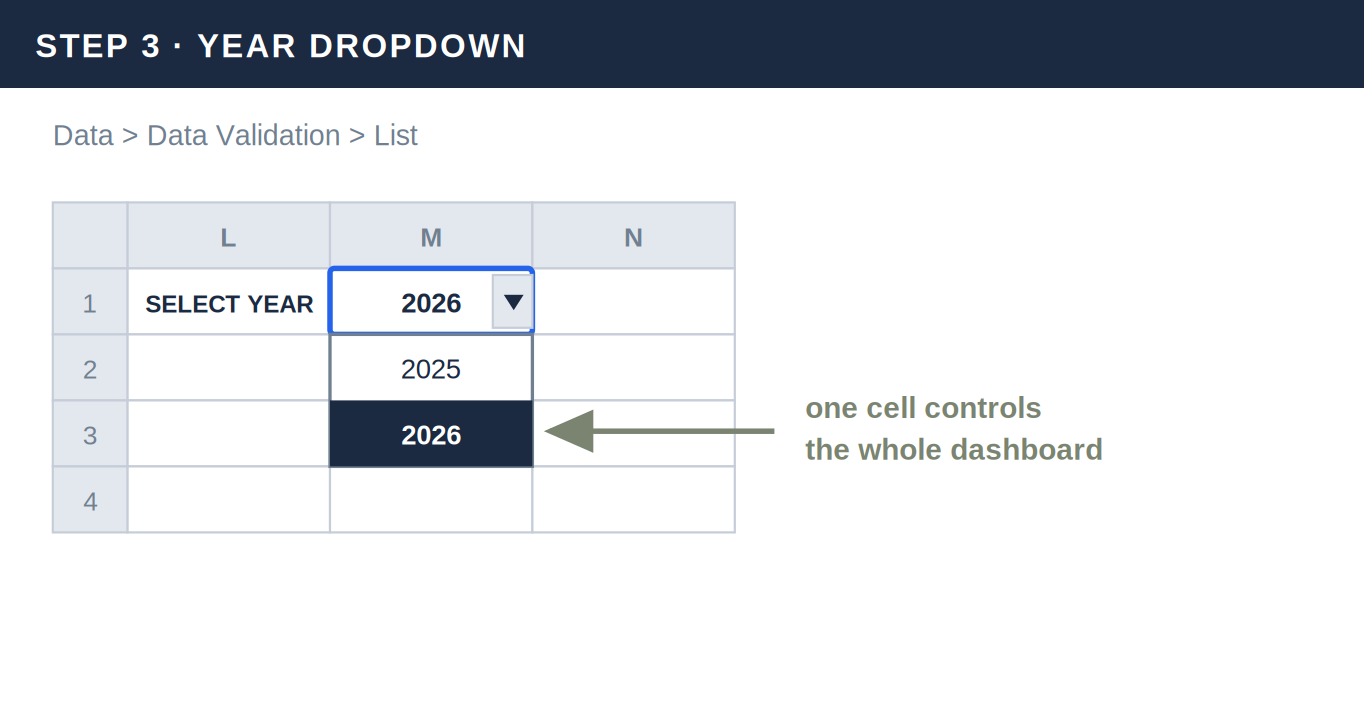
Pick one cell to control the whole dashboard. Select it, go to Data > Data Validation > List, and enter your years, like 2025, 2026.

This one cell is your dashboard's steering wheel. Everything you build next reads from it.

Year dropdown control for a dynamic Excel dashboard

Step 4: Pull the selected year's data with FILTER

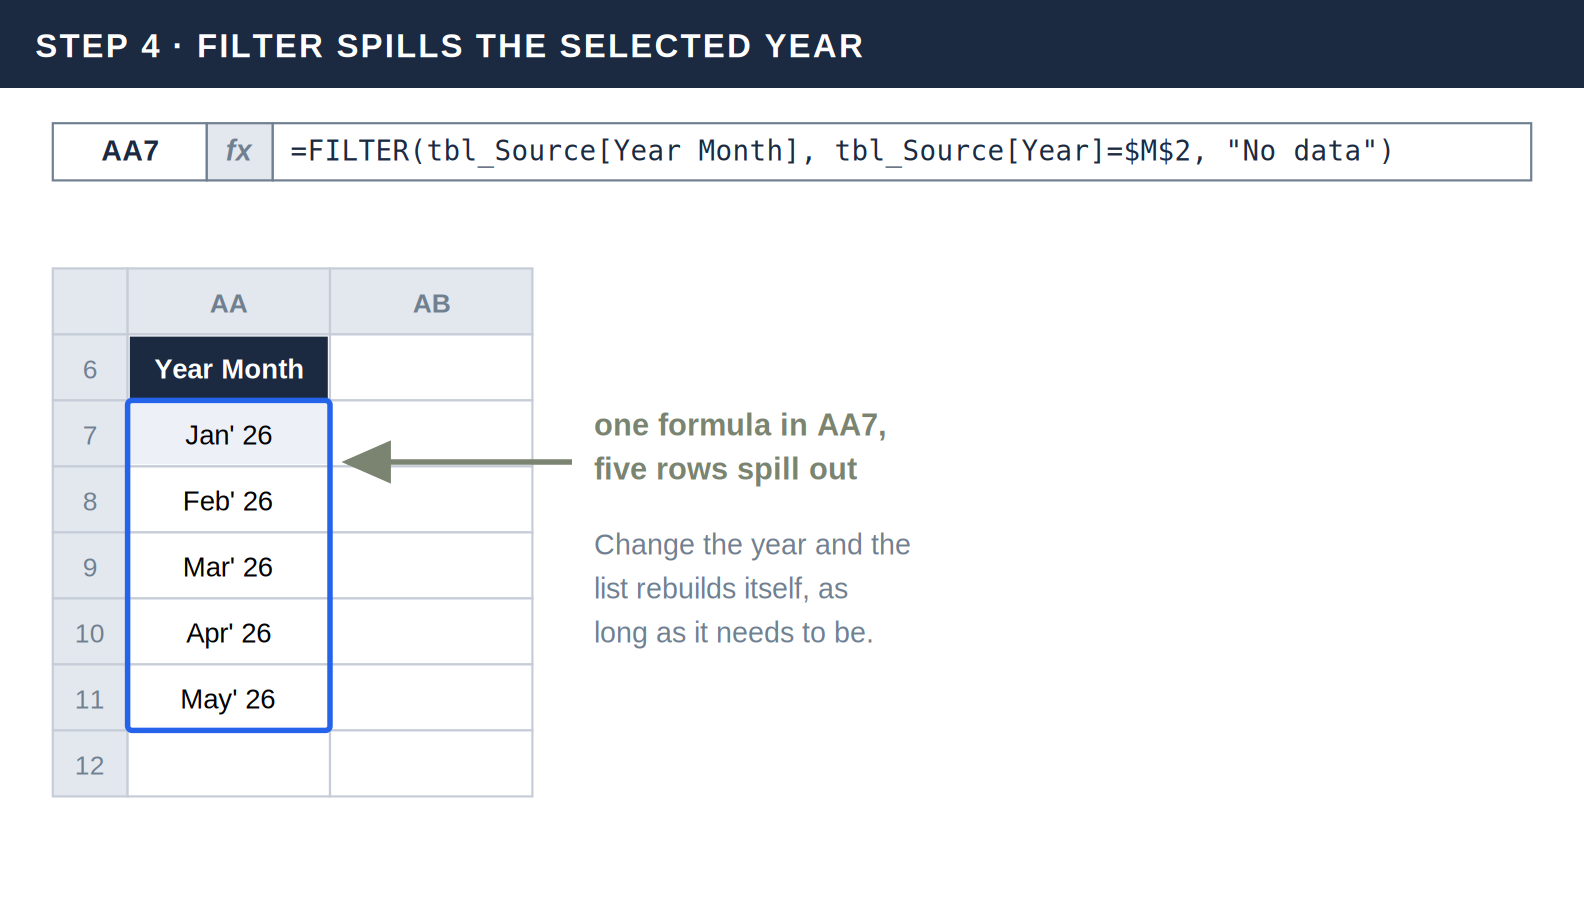
In an out-of-the-way column, write:

=FILTER(tbl_Source[Year Month], tbl_Source[Year]=$M$2, "No data")

($M$2 is wherever you put your dropdown.) This one formula returns every month for the selected year, spilling down as many rows as it needs. Pick a different year in the dropdown and the list rebuilds itself. You write it once and never touch it again.

Excel FILTER function spilling filtered data by selected year

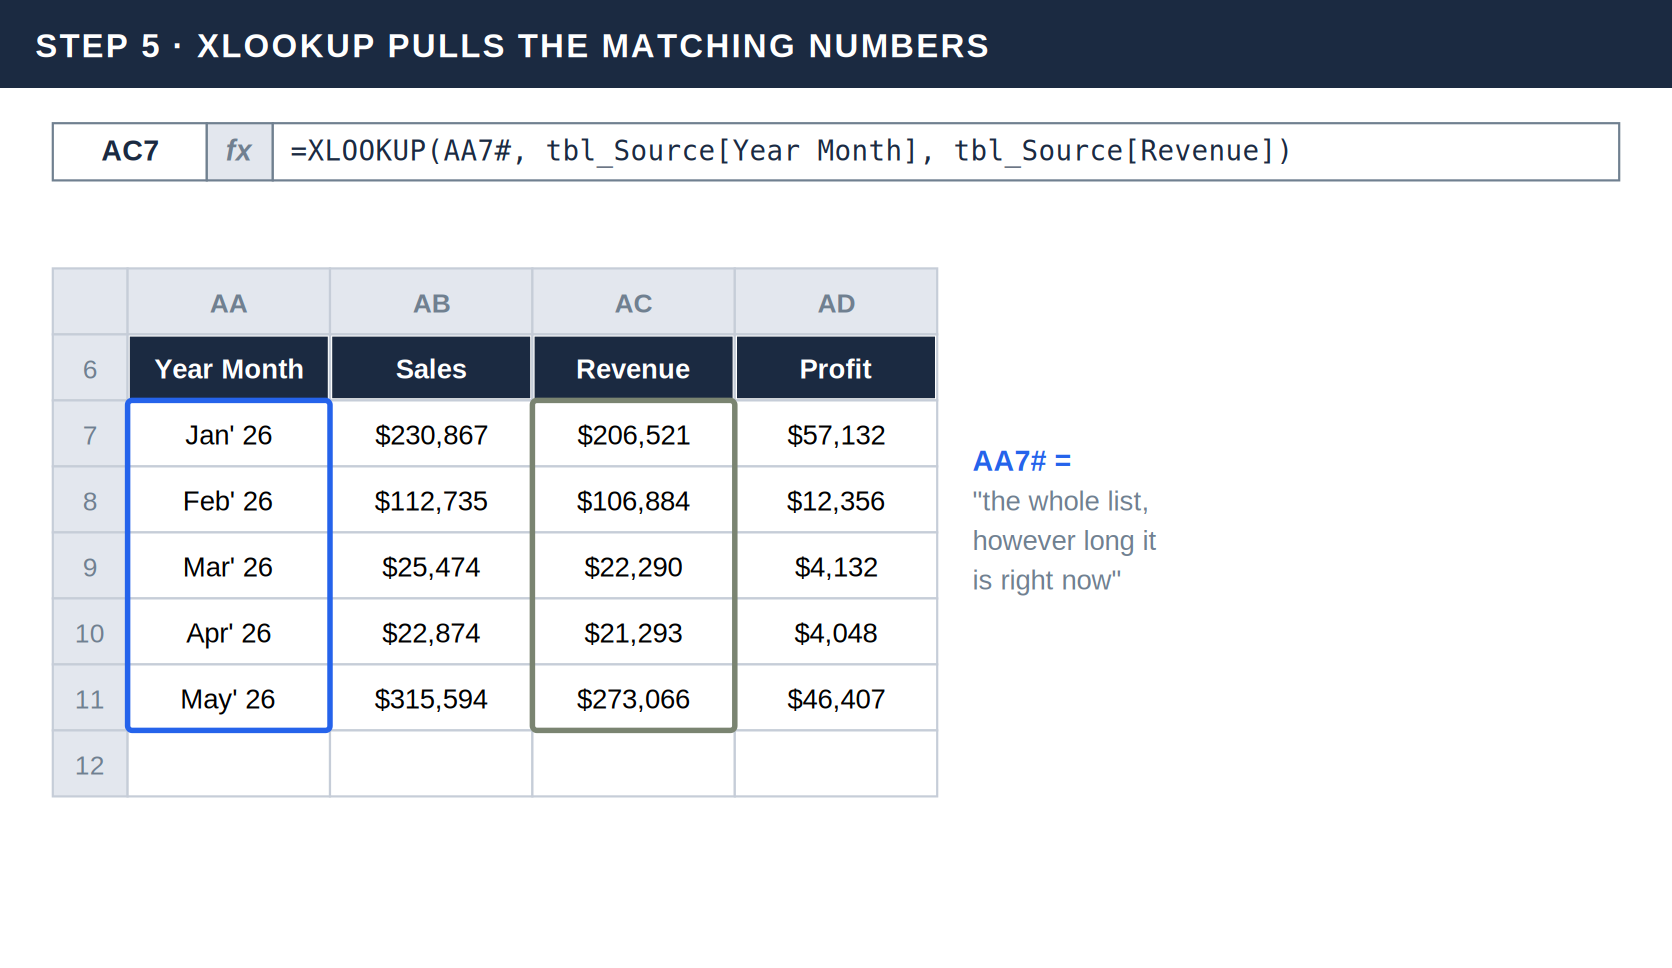
Step 5: Pull the matching numbers with XLOOKUP

Next to your month list, bring in the numbers for each month:

=XLOOKUP(AA7#, tbl_Source[Year Month], tbl_Source[Revenue])

AA7 is the first cell of your FILTER list, and the # tells Excel "the whole list, however long it is right now." Repeat this formula for each column you want, like Sales, Profit, and Units. When the month list grows or shrinks, these columns follow automatically.

Excel XLOOKUP with spill operator pulling matching values for a dynamic Excel dashboard

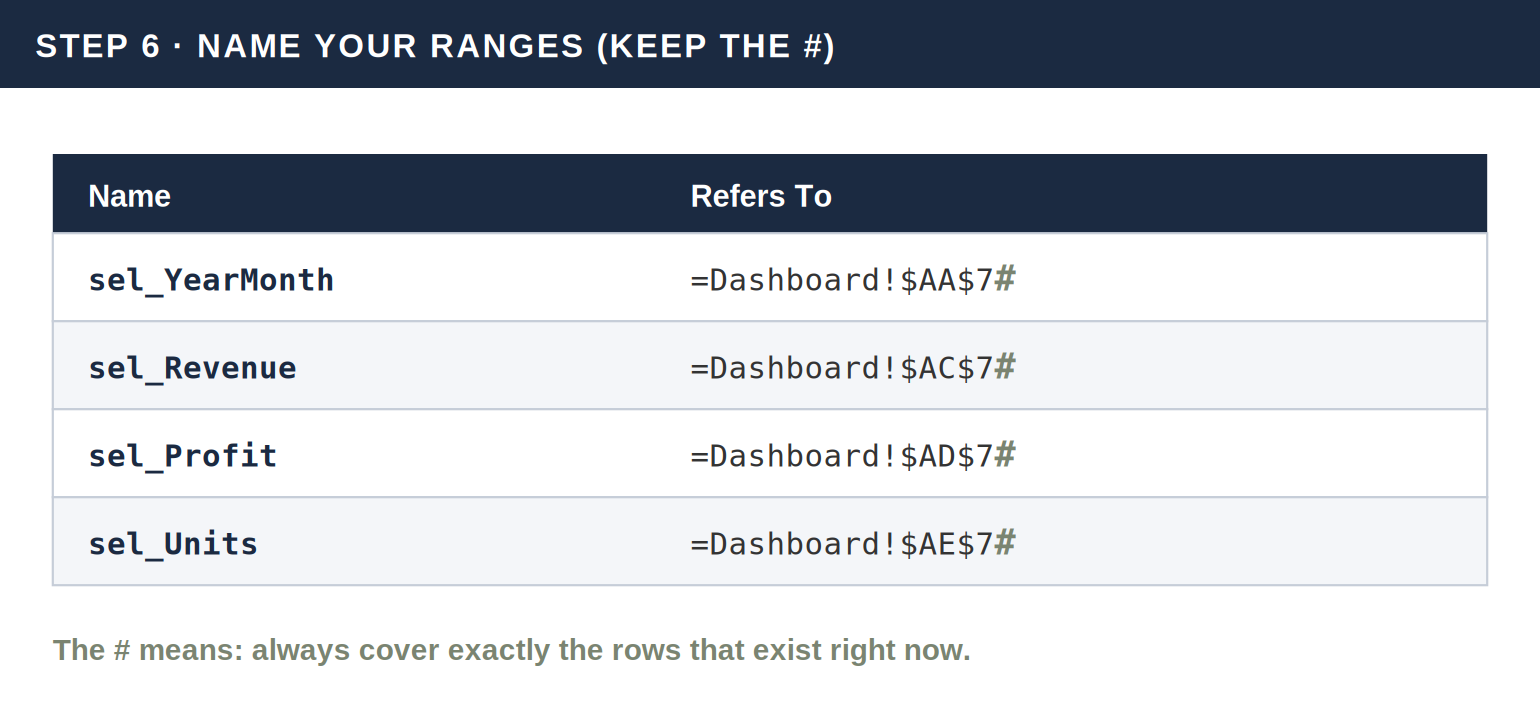
Step 6: Name your ranges

Go to Formulas > Name Manager and create a name for each column you just built, keeping the #:

  • sel_YearMonth = Dashboard!$AA$7#
  • sel_Revenue = Dashboard!$AC$7#
  • sel_Profit = Dashboard!$AD$7#
  • sel_Units = Dashboard!$AE$7#

These names are what make the next two steps easy. Because of the #, each name always covers exactly the rows that exist right now.

Excel named ranges with spill operator for a dynamic dashboard

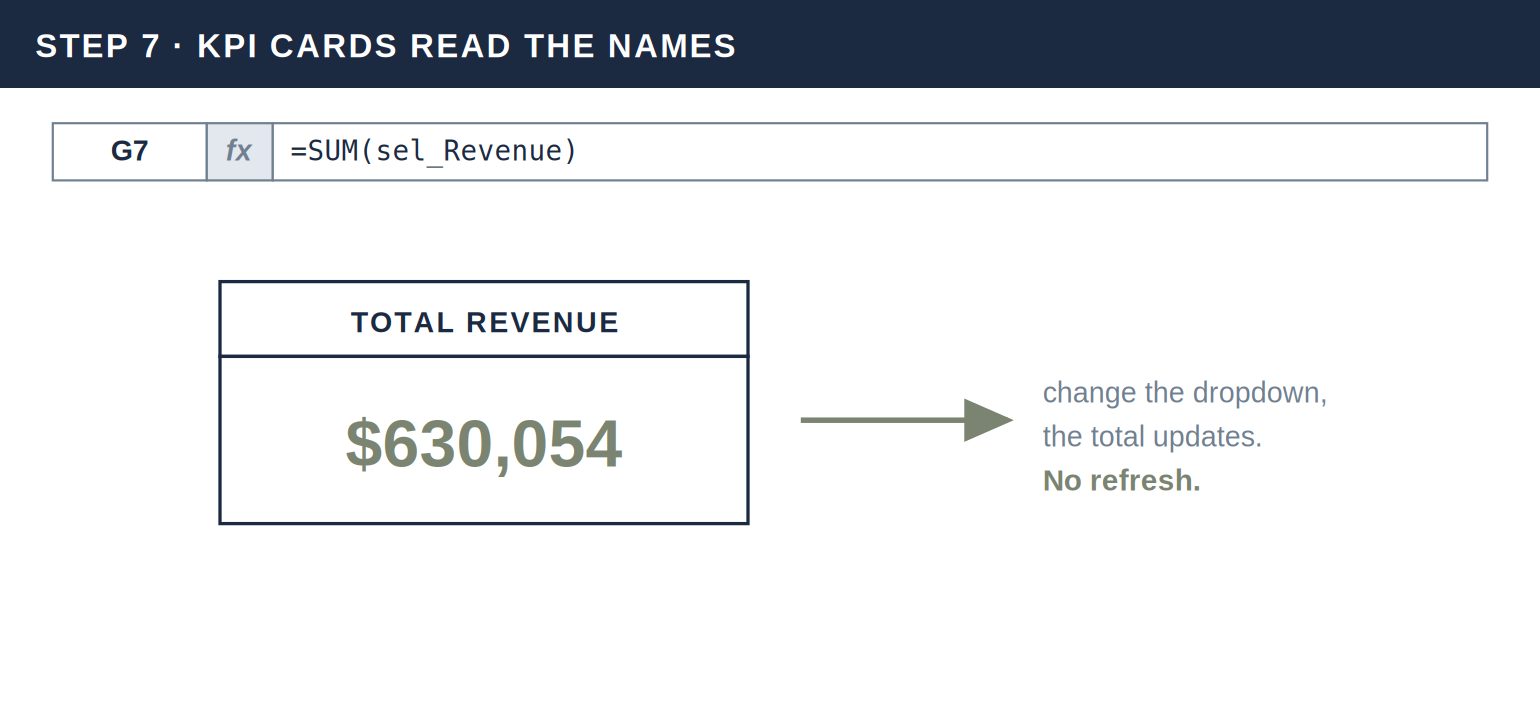
Step 7: Point your KPI cards at the names

Your totals become one-line formulas:

=SUM(sel_Revenue)

Change the year in the dropdown and watch the totals change with it. No refresh needed.

Excel KPI cards updating automatically from named ranges

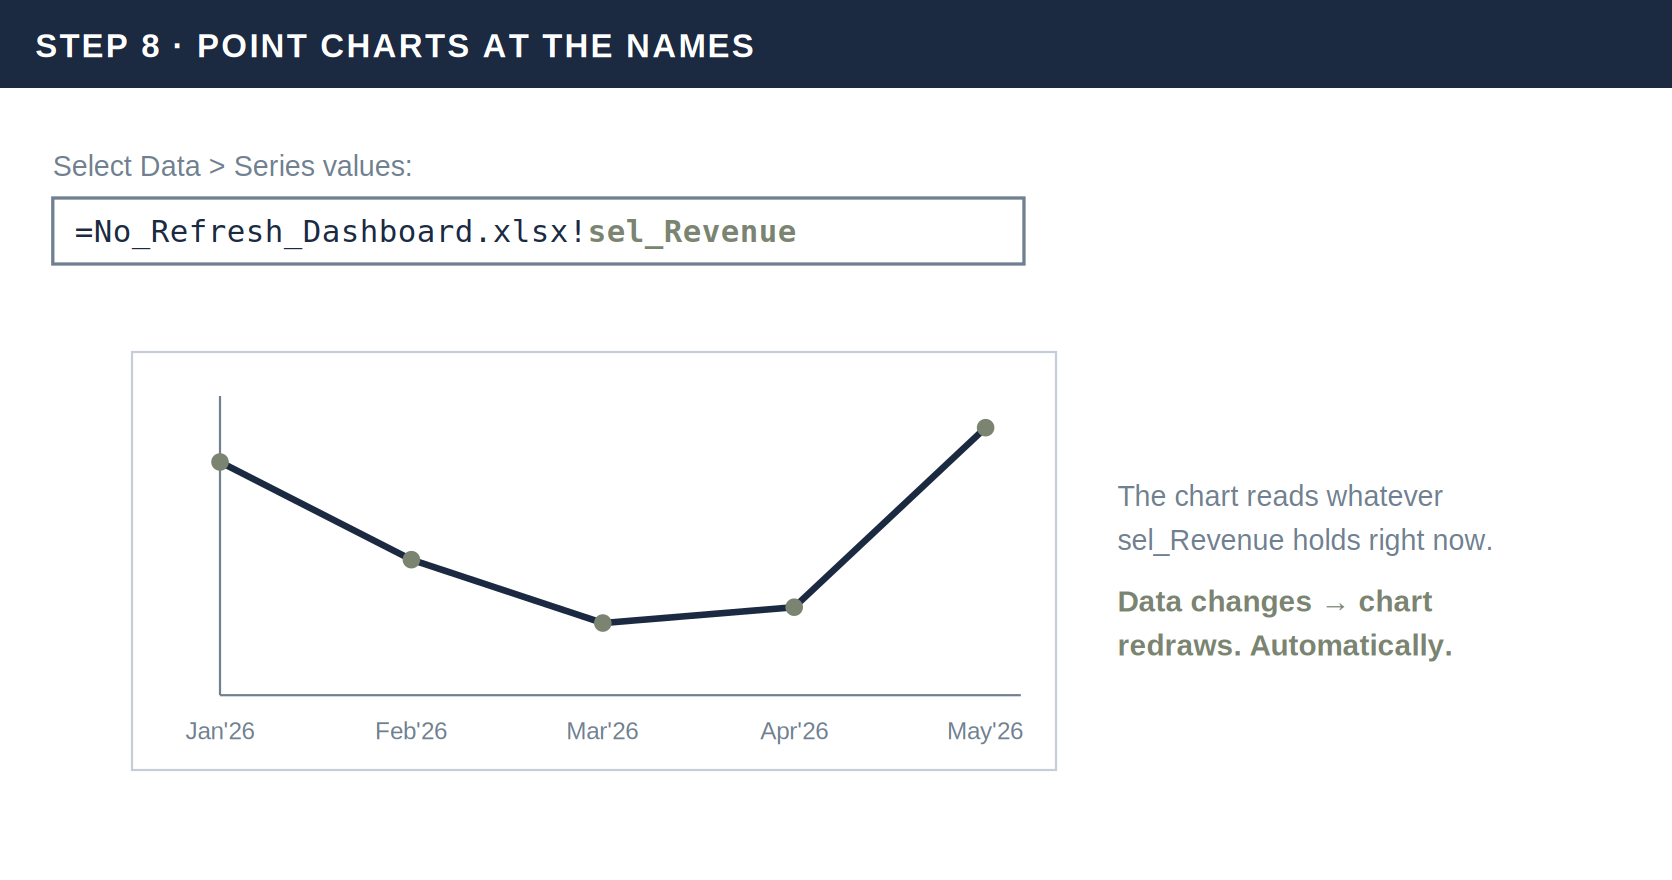
Step 8: Point your charts at the names too

This is the step most tutorials skip. Right-click your chart, choose Select Data, and edit each series. Instead of a fixed range, type the workbook name plus the named range:

=YourWorkbookName.xlsx!sel_Revenue

Do the same for the axis labels using sel_YearMonth. Your chart now reads from a range that resizes itself, which means it redraws the moment your data changes.

Excel chart bound to a named range updating automatically

Why this never needs a refresh

Pivot tables keep a copy of your data and only update that copy when you ask. This setup keeps no copy. Every formula reads live from your Table, every time Excel recalculates, which is every time anything changes.

Change the dropdown, and the FILTER list rebuilds, the XLOOKUP columns follow, the named ranges resize, and every KPI and chart pointed at them updates. It's one chain reaction, and it runs itself.

Pivot tables hold a copy of your data. This setup holds nothing. It reads live, every time anything changes.

Four things to know before you build

You need Excel 2021 or Microsoft 365. The # operator and FILTER don't exist in older versions.

Chart references need the workbook name. If you rename the file, update the chart references to match.

XLOOKUP grabs the first match only. If the same month appears on multiple rows, it won't add them together. The template's data is structured so this isn't an issue, and it's something to keep in mind with your own data.

Don't type over the date columns. They're formulas. Overwriting one breaks the chain below it.

The pattern, in one line

Table, FILTER, XLOOKUP, named ranges with #, charts pointed at the names. Each layer feeds the next, nothing is hardcoded, and the dashboard just works.

We build dynamic Excel dashboards this way at XINDARA because it meets people where they already work. No new software, no new skills for the team. They update their data and the dashboard keeps up.

Questions, or want help adapting this to something more complex like multiple regions or rolling 12-month views? Reach out at team@xindara.com.

Get the free template with everything already built.

Data table, year dropdown, KPI cards, and two live charts, all wired together with the exact steps above, plus an Instructions tab that walks through every formula. Enter your email below and we'll send the download link.

Where accuracy matters most
that's where we work

We work anywhere documents carry risk, financial impact, or compliance requirements.

What you're probably
wondering

Quick answers to the most common questions

How do I make an Excel dashboard update automatically without a refresh?

Build it on ranges that resize themselves instead of fixed cell references. Start with an Excel Table to hold your data, since Tables absorb new rows automatically. Use FILTER to pull the slice you want and XLOOKUP to line up the matching numbers, then name those results with the # spill reference operator so the named range grows and shrinks with your data. Point your charts and KPI cards at those names instead of a fixed range, and the whole dashboard updates the moment your data changes. No Refresh button, no macros, no Pivot Tables. It works in Excel 2021 and Microsoft 365.

Why does my Excel chart not update when I add new data?

Your chart is pointed at a fixed range, so it only sees the rows it was given when you built it. A chart bound to B2:B50 will never pick up row 51, and a formula like SUM(B2:B50) has the same blind spot. Pivot tables get around this but hold a snapshot that only updates when someone clicks Refresh, which someone always forgets. The fix is to bind your chart to a named range built with the # spill operator instead of a fixed range, so it resizes with your data and redraws on its own every time anything changes.

Are Pivot Tables the only way to build a dynamic dashboard in Excel?

No. Pivot Tables are one option, but you can build a fully dynamic dashboard with no Pivot Tables, no macros, and no add-ins using dynamic array formulas. An Excel Table holds the data, FILTER and XLOOKUP pull and align the numbers, and named ranges built with the # spill reference operator keep everything sized to the current data. This approach reads live from your source every time Excel recalculates, so unlike a Pivot Table it never holds a stale snapshot and never needs a manual refresh. It's often lighter and easier for a team to maintain since there's nothing to rebuild or re-refresh.

What Excel version do I need for FILTER, XLOOKUP, and the # spill operator?

You need Excel 2021 or Microsoft 365. FILTER, XLOOKUP, and the # spill reference operator are all dynamic array features, and they don't exist in Excel 2019 or earlier. If your formulas return a #NAME? error, that's usually the sign you're on a version that doesn't support them. This applies to both Windows and Mac, and to the web version of Excel in a Microsoft 365 subscription. If your team is on an older version, upgrading to Microsoft 365 is the only way to use this approach, since there's no add-in that backports these functions.

How to Build a Dynamic Excel Dashboard That Updates Automatically

The risks of quoting in Excel

ARTICLE

The risks of qouting in Excel

Still quoting in Excel? This article explains where the real risk comes from and how manufacturers reduce risks without giving up Excel.

By Dami O. | 06/14/26

Why Excel remains the default for quoting

Many manufacturers and project-based firms still rely on Excel for quoting. It feels fast and familiar, but as quote volume grows, pricing errors, inconsistencies, and compliance gaps grow with it. Teams use Excel because it works under pressure. It is flexible, easy to adjust, and quick when a salesperson needs to respond fast.

The risk begins when Excel becomes the system, not just a tool. Manufacturing quotes are complex. Costs change. Labor assumptions shift. Exceptions are common. Excel handles this in the moment, but over time pricing logic spreads across formulas and tabs with little documentation.

What started as a calculator becomes the backbone of quoting. Speed remains, but consistency and control slowly disappear.

Where spreadsheet‑based quoting creates risk

Inconsistent quotes across salespeople

Each salesperson keeps a slightly different version. Pricing methods drift. Assumptions vary. Two similar jobs can receive very different quotes, and no one can clearly explain why.

Manual edits and quiet errors

Formulas are overwritten. Rows are copied incorrectly. Discounts or markups are changed just for one quote and never corrected. These problems are often discovered after the job is already sold.

Price changes not reflected consistently

When pricing logic lives in emailed files and shared drives, it becomes difficult to show consistency, approvals, or trace how a quote was created weeks or months later.

Compliance and audit exposure

Material and market price updates rely on someone remembering to update the correct spreadsheet. Quotes are based on outdated costs depending on which file was used.

A manufacturing example of spreadsheet‑based quoting going wrong

One manufacturing client came to us facing exactly this situation. 

Every salesperson built quotes in their own spreadsheet. Pricing methods differed. Manual edits had crept in over time. Market price changes were not always reflected, depending on which spreadsheet was used.

Leadership had no reliable wayto confirm that quotes followed the same pricing logic.

The problem was not Excel itself. The problem was Excel being used as a shared compliance‑sensitive system.

Moving risk out of the spreadsheet

Instead of trying to eliminate Excel, we changed its role.We moved the core quoting process into a secure, enterprise‑grade web application. That application handled the parts Excel struggle with: One source of truth for material and market pricing

  • Centralized pricing logic
  • Role‑based access so pricing rules could not be casually changed
  • Approval workflows for quotes that required review
  • Sales teams could generate PDF quotes directly from the system with confidence that pricing was current and consistent.

Keeping Excel where it still helps

Excel did not go away. Its role changed. Accounting received Excel workbooks with detailed financial breakouts for review and reconciliation. Construction and operations received their own Excel views focused on the inputs that mattered to them. Every workbook was generated from the same approved source, using consistent logic and current data. 

Excel became an output, not an uncontrolled system. Spreadsheets were no longer emailed around. No one questioned which version was correct. Compliance no longer depended on individual discipline. This approach also challenged a common assumption that improving compliance means replacing Excel entirely.

In practice, compliance improves when pricing logic lives in one controlled location, market pricing updates automatically, access and approvals are enforced, and Excel is used for analysis rather than as a source of truth. Teams kept the flexibility they value, while the risks tied to spreadsheet-based quoting were significantly reduced. 

Excel can still play an important role

It just cannot be responsible for everything

Where accuracy matters most
that's where we work

We work anywhere documents carry risk, financial impact, or compliance requirements.

What you're probably
wondering

Quick answers to the most common questions

Why do manufacturers still use Excel for quoting?

Manufacturers continue to use Excel for quoting because it is familiar, flexible, and fast. Sales teams can quickly adjust numbers, test scenarios, and respond to customers without waiting on a system or approval. Excel works well under pressure, especially when quotes are complex and time-sensitive.

What are the risks of using Excel for manufacturing quotes?

The biggest risks of Excel-based quoting are inconsistent pricing, manual errors, outdated costs, and compliance gaps. As spreadsheets are copied, edited, and emailed, pricing logic drifts. Small formula changes or missed updates can lead to underpriced jobs, margin loss, and difficulty explaining or defending quotes later.

Do companies have to replace Excel to improve quoting accuracy and compliance?

No. Improving quoting accuracy does not require eliminating Excel. The key is moving pricing logic, approvals, and source data into a controlled system, while using Excel for outputs and analysis. When Excel stops being the source of truth and becomes a downstream tool, teams keep flexibility without carrying the same risk.

EUCs Are Part of How Banks Actually Work

EUCs Are Part of How Banks Actually Work

ARTICLE

EUCs Are Part of How Banks work

EUCs in banking persist because core platforms rarely keep up with how work actually moves. The banks that manage this well aren't trying to eliminate these tools; they're learning to govern them.

By Dami O. | 06/14/26

End User Computing Tools fill the gaps

In banking circles, End User Computing tools or EUCs are often framed as a risk to eliminate rather than a reality to manage. Spreadsheets, Access databases, Power Apps, and local scripts are typically grouped under “EUC risk,” discussed through remediation plans, inventories, and controls. The implied assumption is that with enough discipline, EUCs would not exist. That framing misses the real reason they persist.

Banks are complex environments where data moves across desks, systems, and regulatory expectations that change faster than core platforms can adapt. When practitioners need answers quickly, they build practical solutions to fill the gaps formal systems leave behind. That is how EUCs emerge. Not as workarounds born of negligence, but as necessary tools tied directly to how work gets done. Pretending these tools should not exist does not reduce risk. It pushes critical activity into places leadership cannot see or support.

What I saw working with GSIBs

My own perspective on this comes from working with GSIBs addressing MRIAs. In that context, EUCs were not fringe tools. They were central.

Teams responsible for data lineage, controls, and regulatory responses were expected to answer detailed questions quickly and accurately. In practice, the official tools often fell short. Vendor data governance platforms lacked the flexibility, interdependency views, or real‑time feedback practitioners needed. Internal tools were rigid, slow to adapt, or simply didn’t model the work as it was actually done.

The most valuable contributions I often made came from buildingwell governed EUCs

These were not wild spreadsheets passed around by email. They were structured, controlled tools. Inputs validated row by row in real time. Clear ownership. Traceable logic. Explicit links to upstream data. Practitioners could move fast and with confidence.

Why forcing everything into tools doesn’t work

A common response to EUC risk is to mandate usage of centralized platforms. In theory, this sounds reasonable. In practice, it often fails.

When tools don’t reflect how people actually work, they create friction. Practitioners still need to do the work, so they rebuild the missing pieces elsewhere. Now the risk hasn’t gone away, it’s just gone dark.

3rd party vendor platforms often assume a world where definitions are settled, workflows are linear, and change is rare.

The environments responding to regulatory findings don’t look like that. They need flexibility, iteration, and speed.

A better way to think about EUCs

The more effective banks we’ve worked with don’t ask how to eliminate EUCs. They ask how to govern them intelligently. That starts by accepting a few realities. Some EUCs are exploratory and low risk. Others are material and deserve tighter controls. Not everything needs enterprise‑grade engineering, but important things need more than good intentions.

Governance becomes practical when EUCs consume data from authorized sources, rather than defining truth themselves. When transformations live upstream and EUCs focus on inspection, analysis, and decision support. When ownership is explicit and lineage is traceable. In that model, EUCs stop being uncontrolled systems and start being governed interfaces.

The role companies like ours play

This is where firms like ours fit naturally. We don’t approach EUCs as something to stamp out or blindly rebuild. We approach them as artifacts of real work. They tell us where official systems fall short and where value is actually created. Our role is to help banks put structure around that reality. To turn fragile EUCs into governed ones. To decide what should stay flexible, what needs guardrails, and what truly belongs in a more durable architecture.

In many cases, the fastest, safest path forward isn’t a rewrite. It’s strengthening what already works, while reducing key‑person risk and improving traceability. That mindset has served our banking clients well, especially in the context of regulatory scrutiny. Not because it ignores risk, but because it addresses it where it actually lives.

EUCs reflect real work in banking

Govern them thoughtfully to reduce risk

Where accuracy matters most
that's where we work

We work anywhere documents carry risk, financial impact, or compliance requirements.

What you're probably
wondering

Quick answers to the most common questions

What are End User Computing (EUC) tools in banking?

End User Computing tools in banking include spreadsheets, Access databases, Power Apps, local scripts, and similar tools built by practitioners to do their work. They emerge when core systems cannot adapt quickly enough to changing regulatory requirements, data questions, or operational needs. EUCs exist because banks are complex and work still has to get done.

Why do EUC tools persist despite bank governance and risk controls?

EUC tools persist because they fill real gaps left by enterprise platforms and vendor systems. When official tools are rigid, slow to change, or poorly aligned with how work actually happens, teams create practical solutions to meet deadlines and regulatory expectations. Treating EUCs as something to eliminate often drives activity underground rather than reducing risk.

How can banks reduce EUC risk without eliminating flexibility?

Banks reduce EUC risk by governing EUCs intelligently instead of trying to remove them. This means sourcing data from authorized systems, keeping transformations upstream, defining clear ownership, and ensuring traceability. When EUCs are used for analysis and decision support rather than as sources of truth, banks maintain speed and flexibility while improving control and regulatory confidence.

Power Apps Are Underrated for MVPs

Power Apps Are Underrated for MVPs

ARTICLE

Power Apps are underrated for MVPs

Power Apps may not be the final system, but they’re a practical way to test workflows and avoid building the wrong solution.

By Dami O. | 06/14/26

Power Apps don’t get much respect

They’re often dismissed as throwaway tools or something to avoid if you care about “doing it right.” What we’ve seen is different. When used intentionally, Power Apps are one of the most practical ways to test automation ideas before turning them into something permanent. When clients tinker with Power Apps, it helps everyone.

Instead of debating requirements in meetings, workflows get exercised in real work. You learn very quickly what actually matters, what people ignore, and what creates friction once it’s used day after day. That information is hard to get any other way. From our side, early Power Apps give us clarity.

Sometimes what a client has built makes sense to keep with better structure and guardrails. Sometimes it needs cleanup, clearer data definitions, and ownership. And sometimes it becomes obvious that the logic and data need to move into Azure with a proper database and service layer for feasibility and scale.

That decision is easier when the workflow has already been tested.

Power Apps also surface bad assumptions early. Not bad intentions, just ideas that sounded valuable until they were used daily. Finding that out early saves time, money, and rework.

SharePoint isn’t a database, and it shows once data volume grows or relationships matter. Performance drops with larger datasets. Collaboration can slow down since canvas apps don’t support true multi‑author editing. Complex logic becomes harder to reason about. Licensing can also escalate quickly once premium connectors or external users are involved.

Those limits tell you when you’ve learned enough and it’s time to engineer something more durable. Used that way, Power Apps help you better define the systems you need.

Build First, Prove Value Fast

Power Apps Make That Possible

Where accuracy matters most
that's where we work

We work anywhere documents carry risk, financial impact, or compliance requirements.

What you're probably
wondering

Quick answers to the most common questions

What are the pros and cons of using Power Apps?

Power Apps are fast to build, integrate well with Microsoft 365, and are effective for testing workflows and automation ideas with real users. They reduce upfront engineering effort and surface requirements early.
The downsides are scale and complexity limits. SharePoint is not a true database, performance drops with large datasets, collaboration is limited in canvas apps, complex logic can get hard to manage, and licensing costs may rise as apps mature.

Are Power Apps good for production or only prototypes?

Power Apps can be used in production for lightweight, well‑defined workflows. They are especially strong as MVPs and early operational tools. As data volume grows, workflows become core processes, or reliability and performance requirements increase, many teams move logic and data into Azure services while keeping Power Apps as a front‑end or validation layer.

When should you not use Power Apps?

Power Apps are not a good fit when you need high‑volume transactional systems, complex data relationships, heavy concurrency, or long‑term extensibility with strict performance guarantees. They are also less suitable when multi‑developer collaboration or fine‑grained control over backend architecture is required. In those cases, traditional application development is usually a better choice.